Avalanche.org

Every field report in a zone, read with the forecast. The signal, in seconds.

Avalanche forecasters start every day buried in field observations. Northwoods built a prototype that reads them alongside the current forecast, cites every claim, and puts what matters most in front of forecasters first. They'll test it through the 2026–27 season.

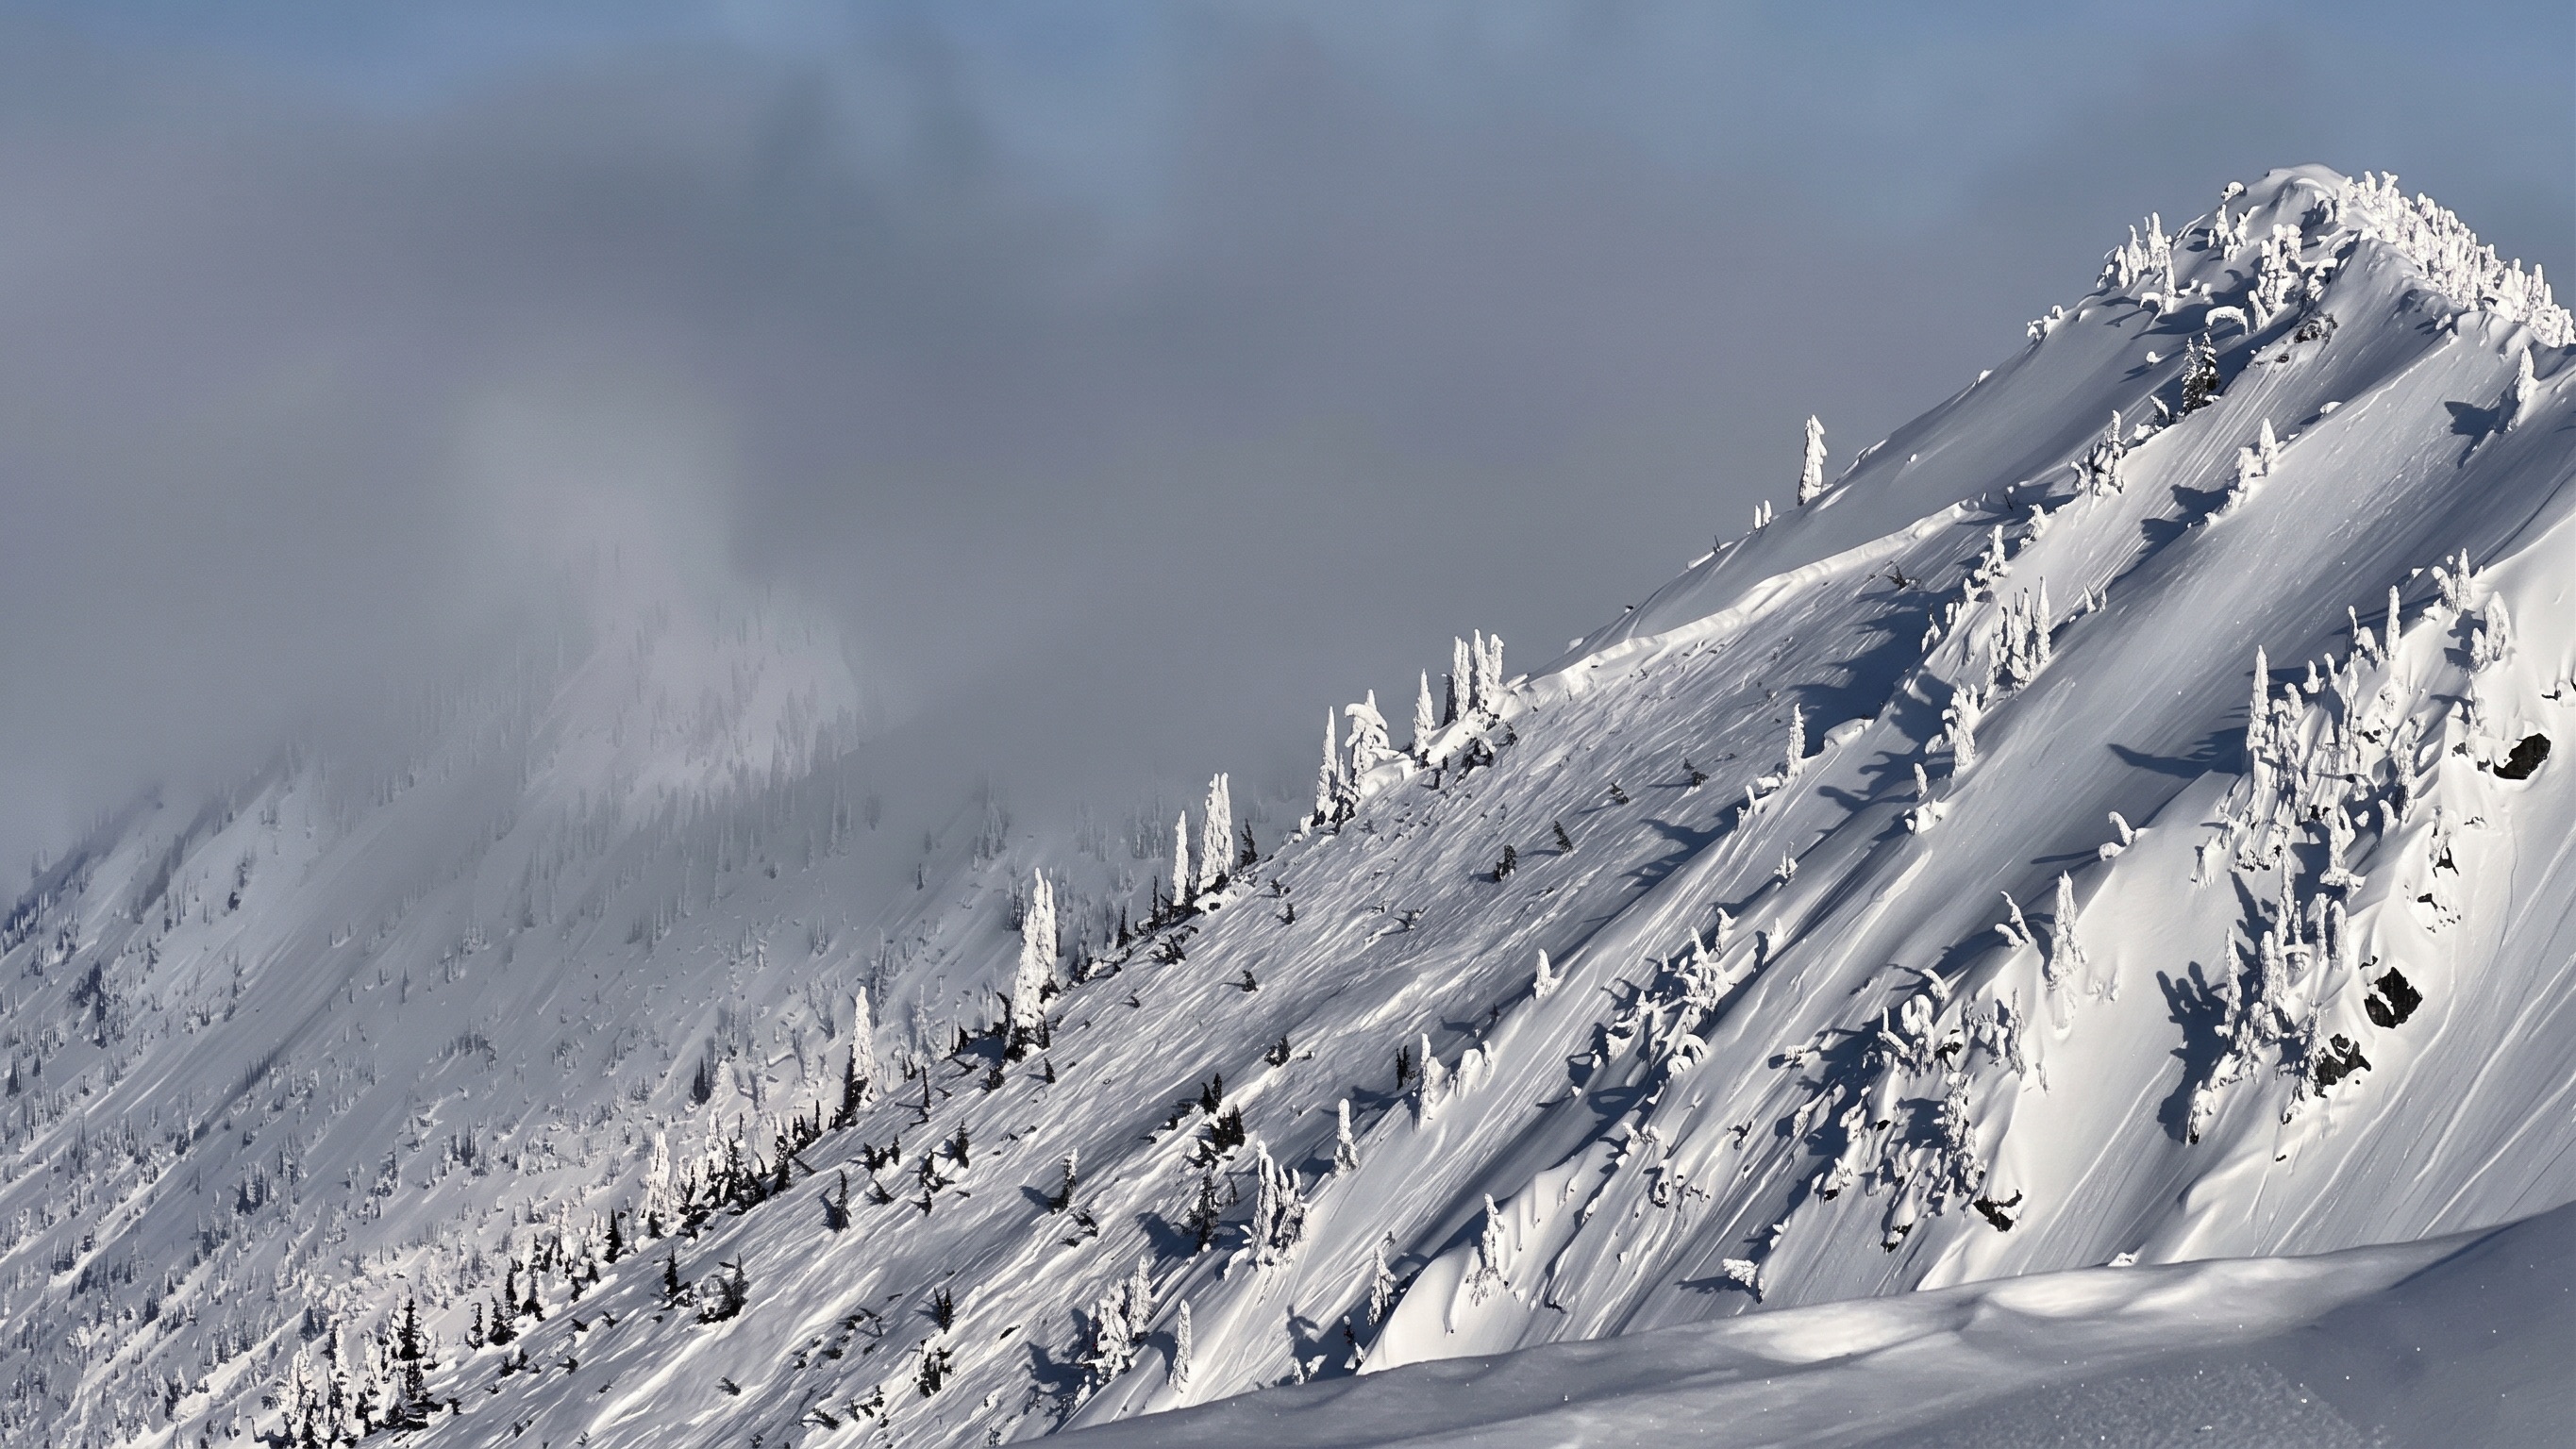
Snow-covered ridgeline with rime-crusted trees under low cloud
Engagement
Discovery, design, build, deploy
Capabilities
Avalanche forecasting, AI synthesis, Geospatial

The problem

Before an avalanche forecaster writes a word of tomorrow's forecast, they have to read what the field is saying — snowpits, cracking and collapsing, slides spotted from the road, notes typed on a phone in a parking lot at dusk.

Avalanche.org is where those observations land, from the public, professional observers, and forecasters alike. Collecting them was never the hard part. Reading them is. A busy zone can see twenty new reports a day, and a forecaster looks back two weeks or more. The signal is in there, spread thin across a lot of people's afternoons — and synthesizing it by hand eats the hours forecasters need for judgment.

What we built

  • 01Pick a zone and a date range — or draw a shape around the exact terrain you're worried about — and every observation inside it lands on one map, one list, and one set of charts.
  • 02A written synthesis of avalanche activity, cracking and collapsing, snowpack, and trend that streams in within seconds. Every claim links back to the observation it came from.
  • 03Forecast-aware synthesis: it reads the published forecast with the field reports, so what's new or significant against current conditions comes first.
  • 04A follow-up chat on every synthesis, so a forecaster can ask "any persistent-slab evidence?" and get an answer grounded in the same observations.

In practice

What this looks like.

01

It never writes the forecast.

Early versions suggested a danger level. We took it out — it risked reading as an official rating, and that's not the job. The platform reads the field and the forecast together and surfaces the signal. The forecaster decides what it means.

02

Code counts, AI narrates.

Every number — how many slides, on which aspects, at what size — is calculated directly from the data before the AI sees it. The model writes the story around facts it can't get wrong, and any citation that doesn't match a real observation is stripped before a forecaster ever reads it.

03

It says what it doesn't know.

A forecaster trusts a summary that names its blind spots. Each synthesis calls out thin coverage — no reports from north aspects, nothing above treeline in five days — instead of papering over it.

How we worked

Embedded, in four beats.

  1. 01

    Listen

    A working session with forecasters to learn how observations actually fit into the morning forecast — and to scope the pilot down to what would matter first.

  2. 02

    Prototype

    Two days later, a working dashboard on real data — a full backfill of observations, decoded and mapped, with the first AI synthesis running against it.

  3. 03

    Refine

    Weekly iteration on what forecasters trust: streaming output, clickable charts, citations on every claim, custom areas, and reading the forecast alongside the field.

  4. 04

    Field test

    Through the 2026–27 season, forecasters use the prototype on real mornings, and we keep refining it around what holds up in the field.

Outcomes

By the numbers.

This winter is the real test. Forecasters will use the prototype through the 2026–27 season, and we'll keep shaping it around what they trust.

Here's where it stands going in.

2 days
from first meeting to a working dashboard on real data
~2 sec
to the first words of a synthesis, streamed as it's written
100%
of claims linked back to the observation they came from